
Measuring Instagram Story performance is crucial for understanding how your content resonates with your audience and for optimizing your social media strategy. Instagram Insights provides a comprehensive set of metrics to analyze your Instagram Stories. Here's how you can use these metrics effectively:
Accessing Instagram Insights
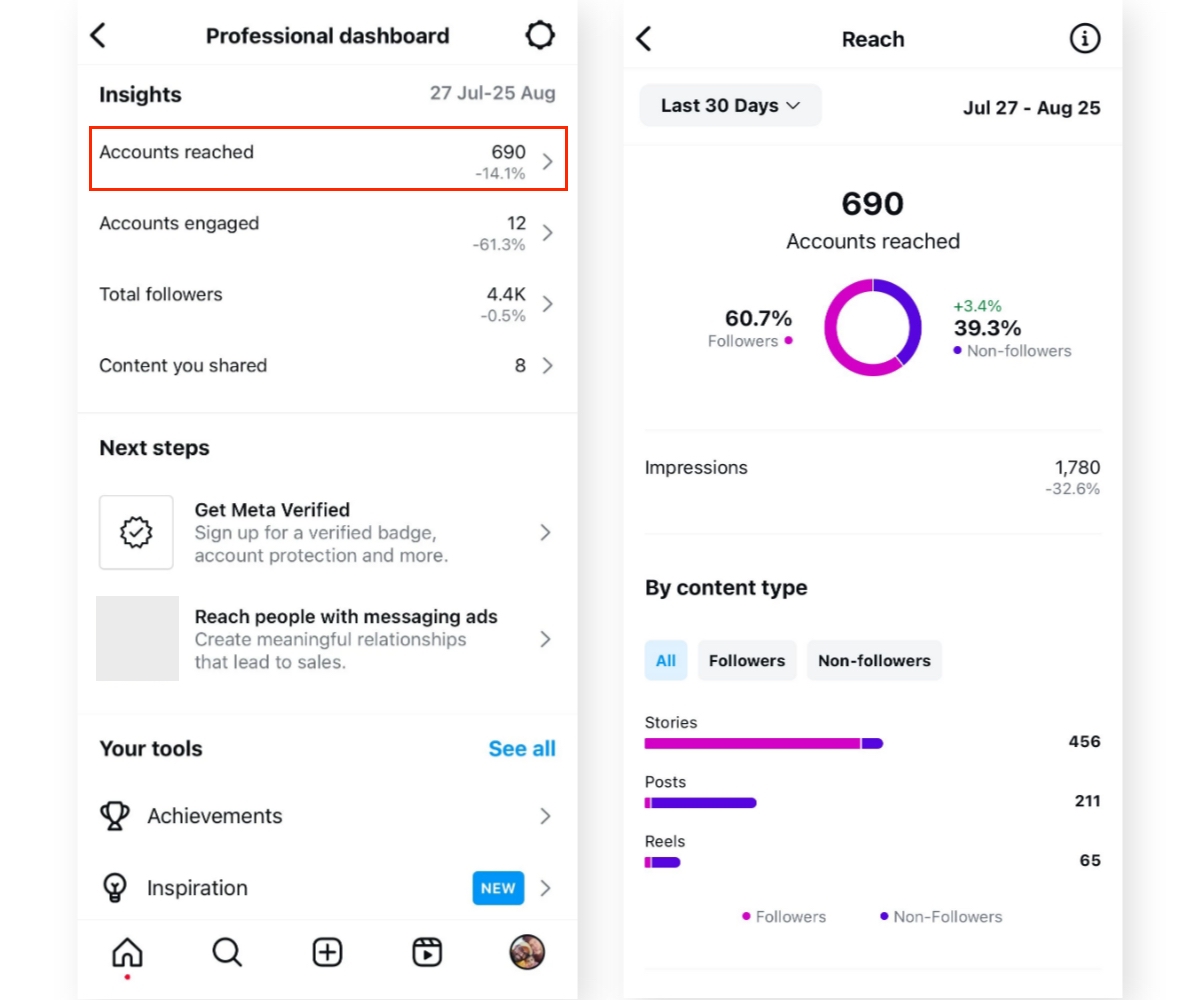
To access Instagram Insights, you need a business or creator account. You can view insights for current stories by swiping up on a live story, and for past stories, navigate to the "Stories" section under "Content You Shared" via your profile's Insights button.
Key Metrics to Track
Instagram Story metrics are categorized into Discovery, Navigation, and Interactions. Here are the key metrics to focus on:
Discovery Metrics
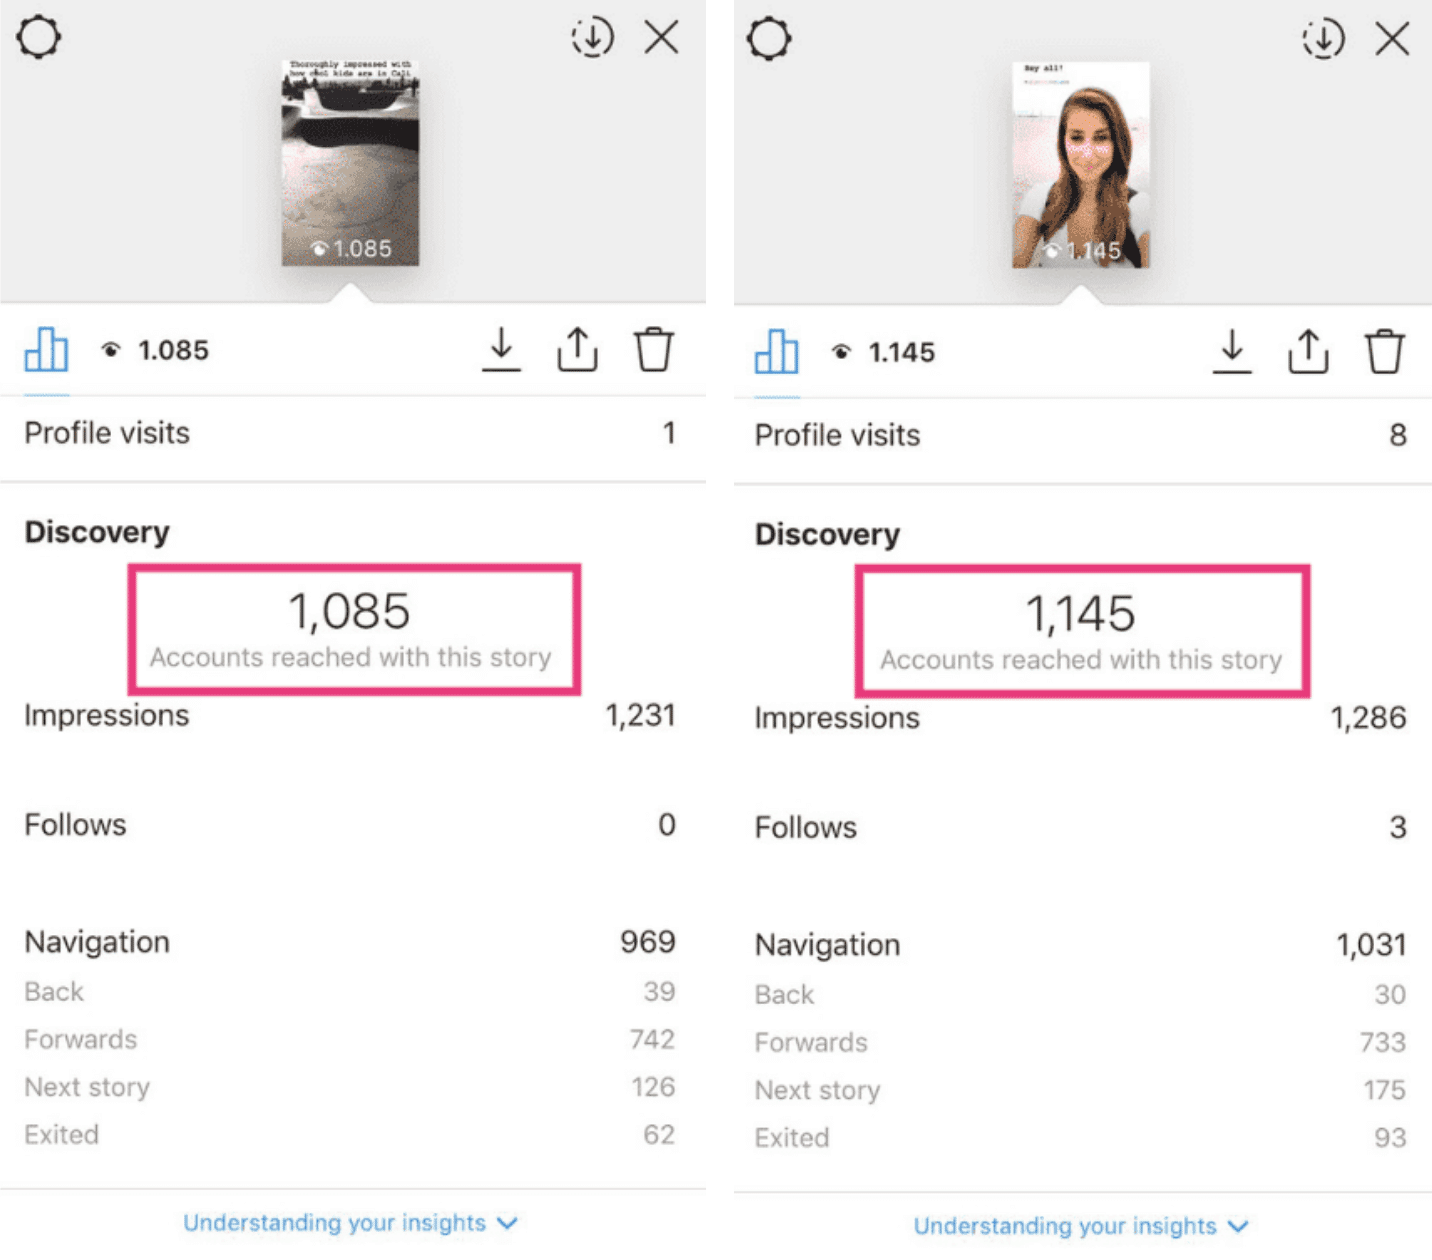
- Reach: The number of unique accounts that viewed your story. This metric helps assess brand exposure.
- Impressions: The total number of times your story was viewed, including repeat views. High impressions suggest engaging content.
- Follows: The number of new followers gained from your story, indicating brand awareness growth.
Navigation Metrics
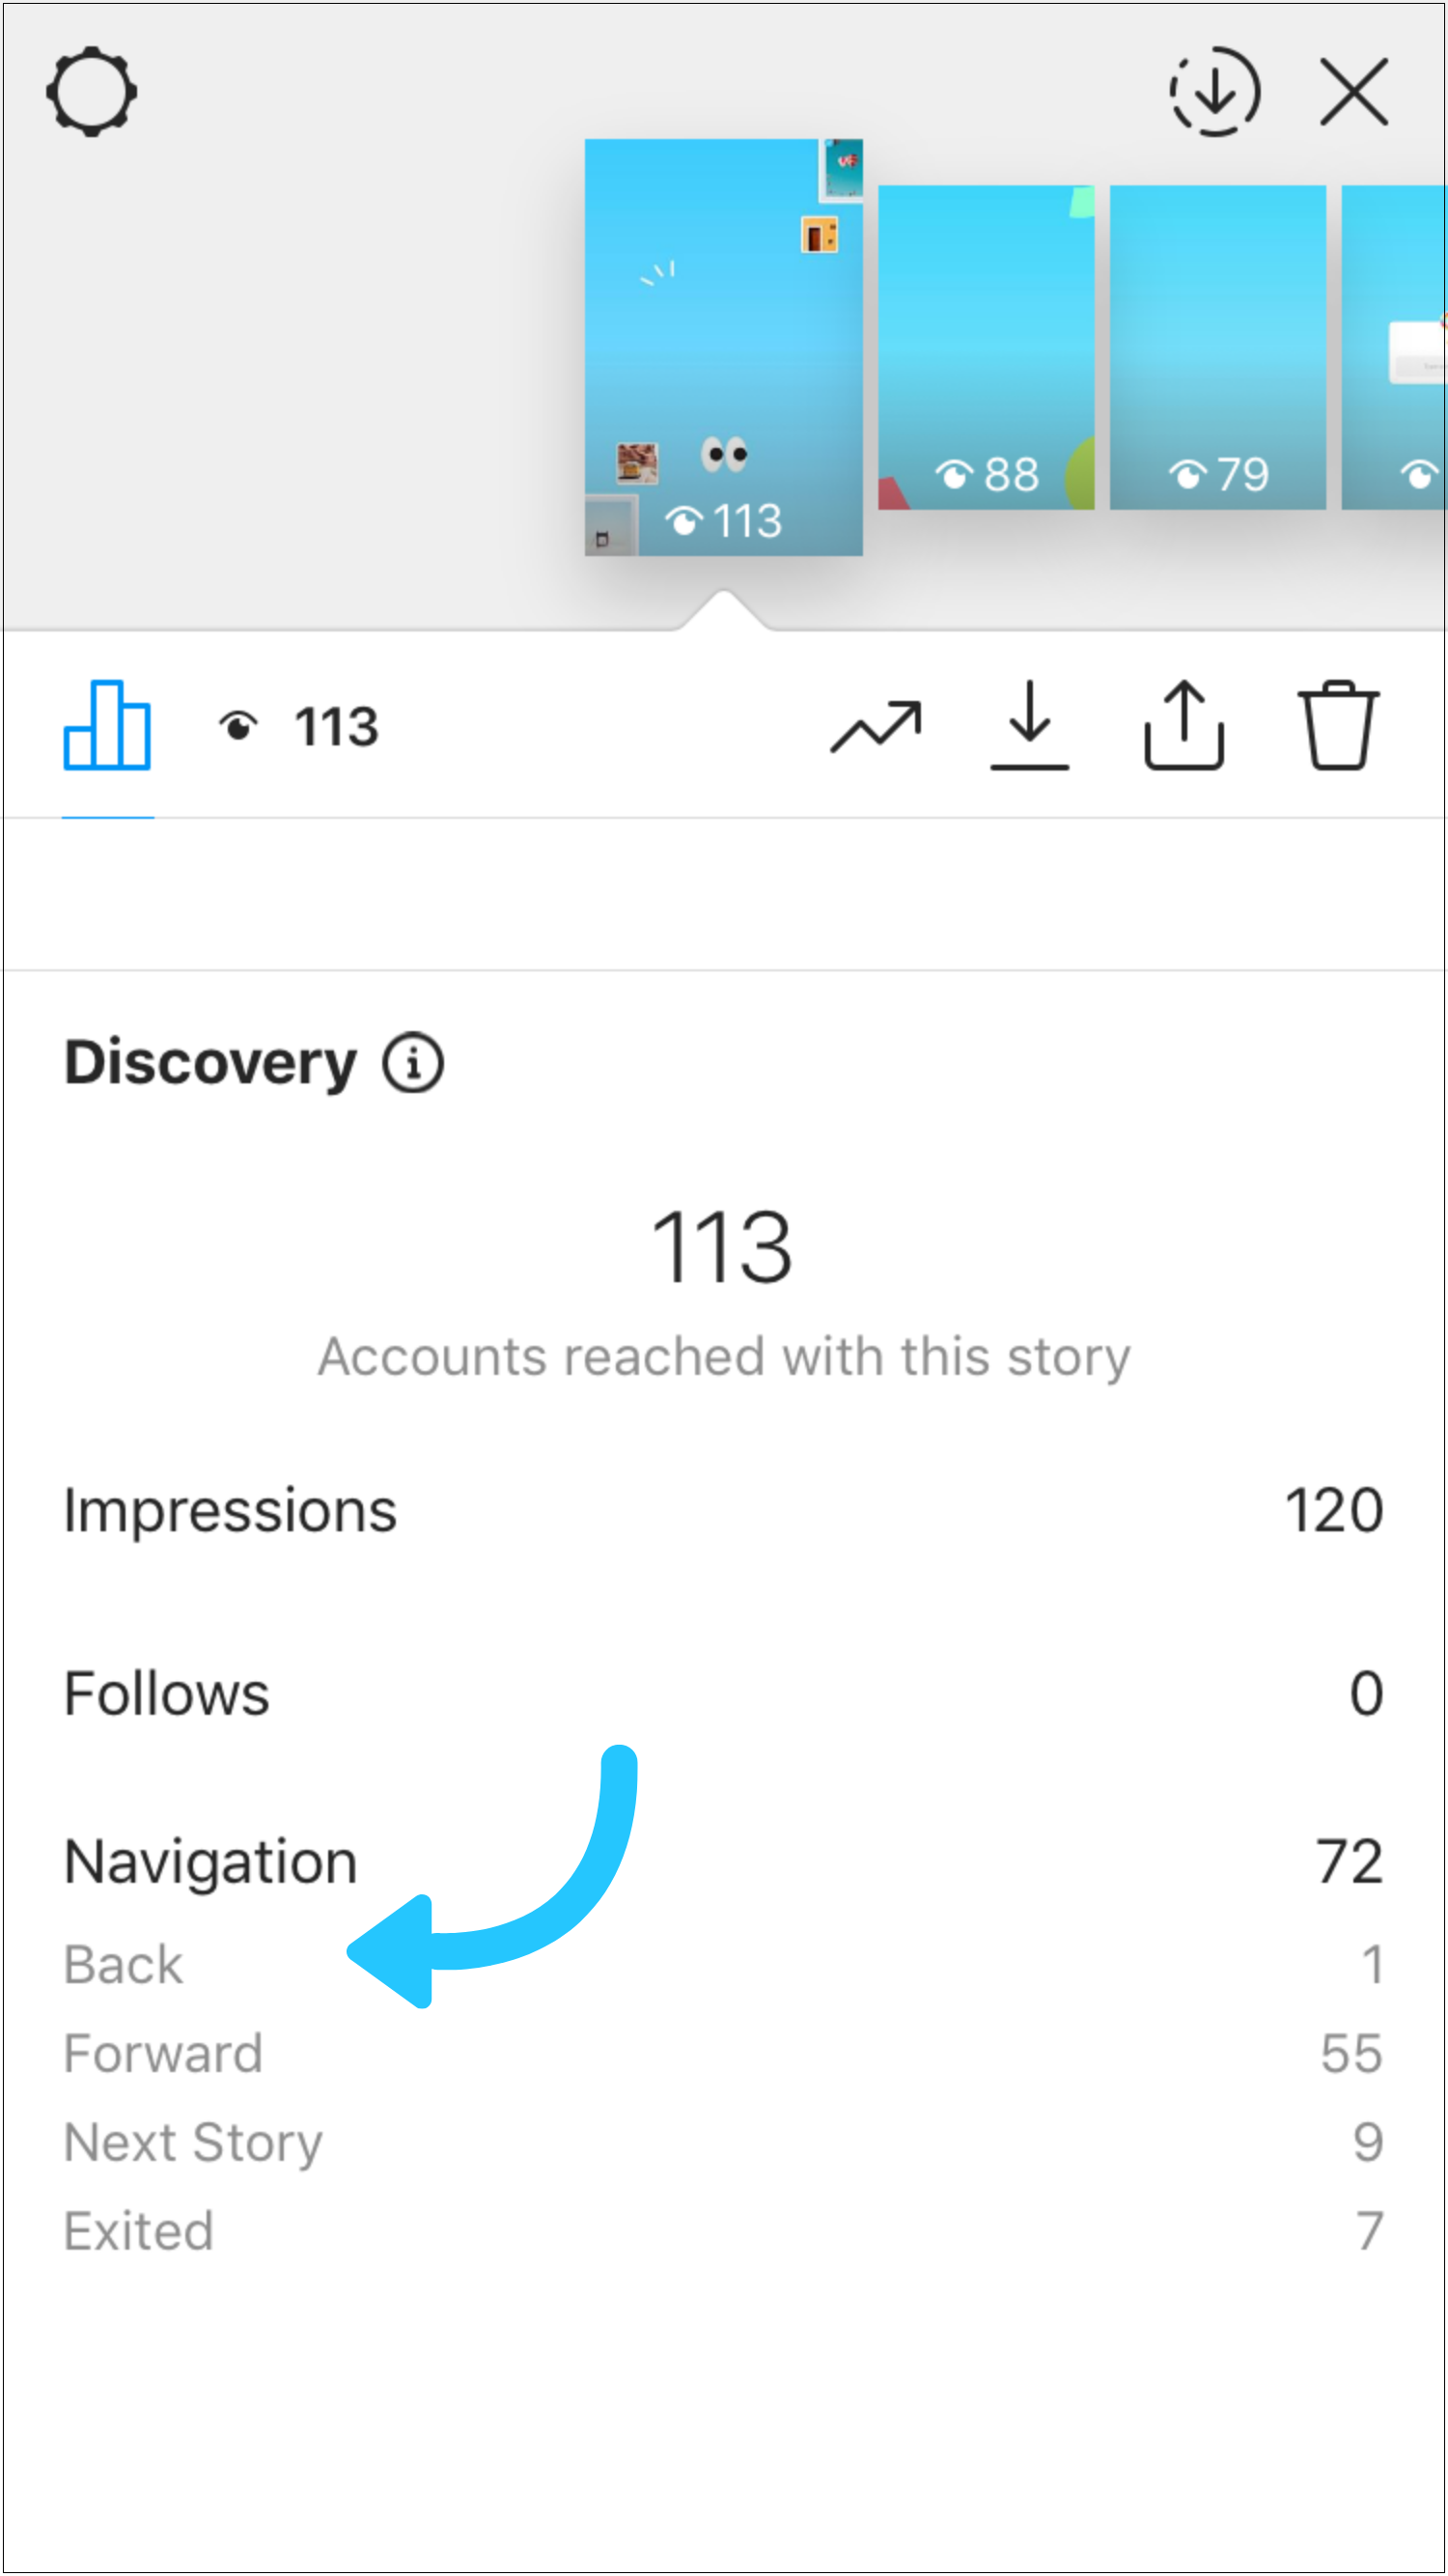
- Forward Taps: The number of times viewers tapped to the next story. High forward taps may indicate that your content isn't engaging enough.
- Back Taps: The number of times viewers tapped back to see the previous story. High back taps suggest that your content is worth rewatching.
- Next Story Swipes: The number of times viewers swiped to the next story. This metric helps understand content flow.
- Exit Story Taps: The number of times viewers exited your story. High exit taps indicate that your content may not be capturing attention.
Interaction Metrics
- Replies: The number of times viewers replied to your story. High replies indicate engagement and dialogue.
- Profile Visits: The number of times viewers visited your profile from your story. This metric shows interest in your brand.
- Sticker Taps: The number of times viewers interacted with stickers (e.g., geotags, hashtags).
- Link Clicks: The number of times viewers clicked on links in your story. This metric is crucial for tracking conversions.
- Swipe Ups: The number of times viewers swiped up on your story to visit a linked page.
Using Insights to Improve Performance
- Analyze Engagement: Focus on interaction metrics to understand how engaging your content is.
- Optimize Content Flow: Use navigation metrics to refine your story sequence and keep viewers engaged.
- Enhance Discovery: Leverage discovery metrics to gauge your reach and adjust your strategy to attract new viewers.
- Adjust Strategy: Use real-time insights to make immediate adjustments to your content strategy.
By tracking these metrics and adjusting your strategy accordingly, you can significantly improve the performance of your Instagram Stories and enhance your overall social media presence.


Maple Ranking offers the highest quality website traffic services in Canada. We provide a variety of traffic services for our clients, including website traffic, desktop traffic, mobile traffic, Google traffic, search traffic, eCommerce traffic, YouTube traffic, and TikTok traffic. Our website boasts a 100% customer satisfaction rate, so you can confidently purchase large amounts of SEO traffic online. For just 720 PHP per month, you can immediately increase website traffic, improve SEO performance, and boost sales!
Having trouble choosing a traffic package? Contact us, and our staff will assist you.
Free consultation