
RAID performance metrics primarily involve read/write speeds and fault tolerance, which vary significantly depending on the RAID level and implementation (hardware vs. software RAID).
Read/Write Speeds
-
RAID 0 offers the highest read/write speeds because it stripes data across multiple disks without redundancy, effectively multiplying throughput by the number of disks. It has no write penalty, so write operations are as fast as possible. However, it provides no fault tolerance.
-
RAID 1 mirrors data across disks, providing fault tolerance by duplicating data. Read speeds can be improved since reads can be served from either disk, but write speeds are generally similar to a single disk because data must be written to both disks.
-
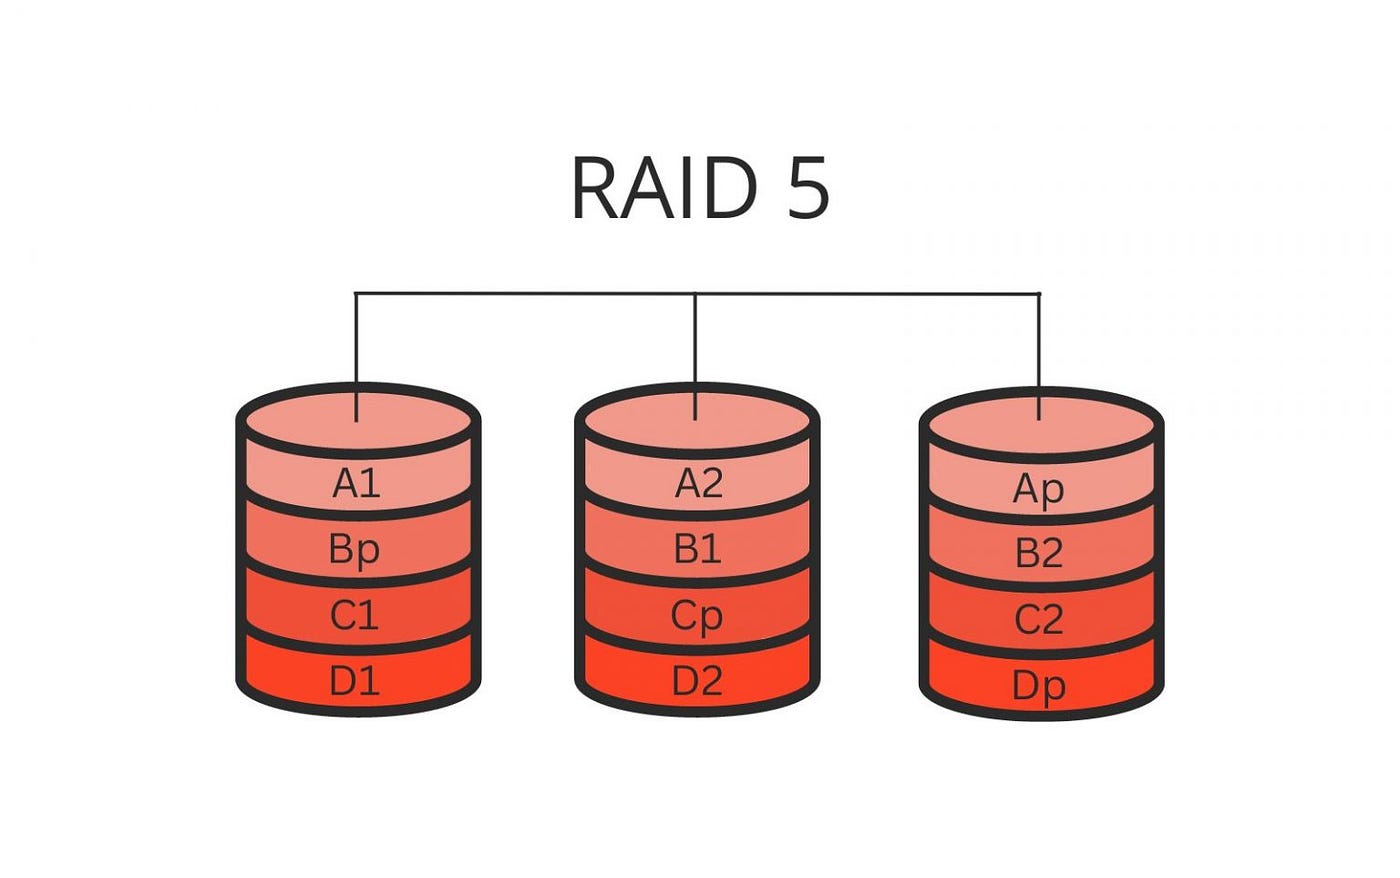
RAID 5 uses striping with parity, which allows fault tolerance with less storage overhead than mirroring. However, it incurs a write penalty because each write requires multiple read and write operations to update parity data. This results in slower write speeds compared to RAID 0 or RAID 1, especially for random writes. For example, RAID 5 needs four I/O operations for each write, reducing effective IOPS and increasing latency.
-
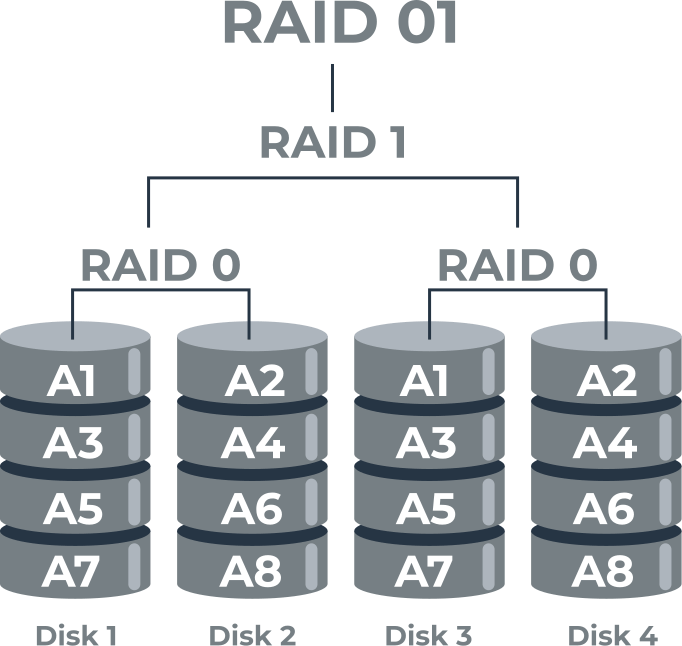
RAID 10 (a stripe of mirrors) combines the benefits of RAID 0 and RAID 1, offering both improved read/write speeds and fault tolerance. It generally outperforms RAID 5 in write performance and latency because it avoids parity calculations.
-
Hardware RAID generally provides lower latency and higher performance than software RAID, which can achieve higher bandwidth but at the cost of increased latency, especially with many disks.
Fault Tolerance
-
RAID 0 provides no fault tolerance; a single disk failure results in total data loss.
-
RAID 1 offers fault tolerance by mirroring data; if one disk fails, the system continues operating with the other disk.
-
RAID 5 can tolerate the failure of one disk without data loss due to parity information.
-
RAID 10 can tolerate multiple disk failures, provided no mirrored pair loses all disks simultaneously, offering higher fault tolerance than RAID 5 in many cases.
Summary Table
| RAID Level | Read Speed | Write Speed | Write Penalty | Fault Tolerance | Typical Use Case |
|---|---|---|---|---|---|
| RAID 0 | Highest (striping) | Highest (no penalty) | 0x | None | Speed-critical, non-critical data |
| RAID 1 | Improved (mirroring) | Similar to single disk | 2x (write to both disks) | Yes (mirroring) | Critical data needing redundancy |
| RAID 5 | Good | Slower (parity calc) | 4x | Yes (single disk failure) | Balanced performance and redundancy |
| RAID 10 | Very good | Very good | 2x | Yes (mirrored stripes) | High performance and fault tolerance |
Additional Notes
-
Latency is generally lower in hardware RAID compared to software RAID, which may have higher bandwidth but increased latency due to CPU overhead.
-
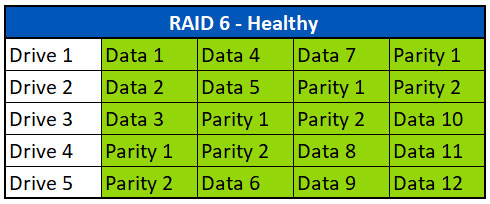
RAID 5 and 6 suffer from write penalties due to parity calculations, which can degrade performance in write-heavy workloads.
-
RAID 10 offers a good balance of performance and fault tolerance, often outperforming RAID 5 in random I/O workloads.
Understanding these metrics helps in selecting the appropriate RAID level based on whether the priority is speed, fault tolerance, or a balance of both.


Maple Ranking offers the highest quality website traffic services in Canada. We provide a variety of traffic services for our clients, including website traffic, desktop traffic, mobile traffic, Google traffic, search traffic, eCommerce traffic, YouTube traffic, and TikTok traffic. Our website boasts a 100% customer satisfaction rate, so you can confidently purchase large amounts of SEO traffic online. For just 720 PHP per month, you can immediately increase website traffic, improve SEO performance, and boost sales!
Having trouble choosing a traffic package? Contact us, and our staff will assist you.
Free consultation