
To create custom reports and dashboards in GA4 tailored for editorial teams, you can leverage GA4’s flexible reporting and visualization tools to monitor key editorial metrics such as user engagement, content performance, and audience acquisition.
Steps to create custom dashboards and reports in GA4:
-
Access GA4 Property and Permissions
Ensure you have editor or administrator-level access to create or customize reports and dashboards. -
Navigate to Reports or Explore Section
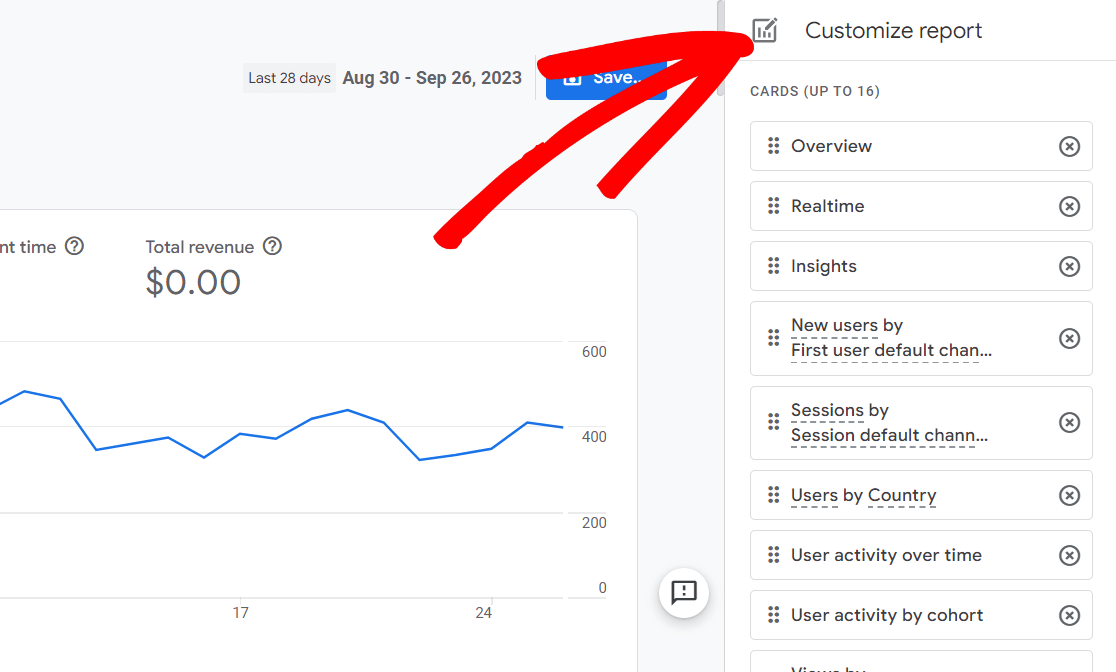
- For dashboards, go to the Reports section, then open the Library at the bottom to create a new overview report (dashboard-style).
- For detailed custom reports, use the Explore section to build Free-Form, Funnel, or Path explorations for deeper analysis of user behavior and content flow.
-
Create or Customize Dashboards
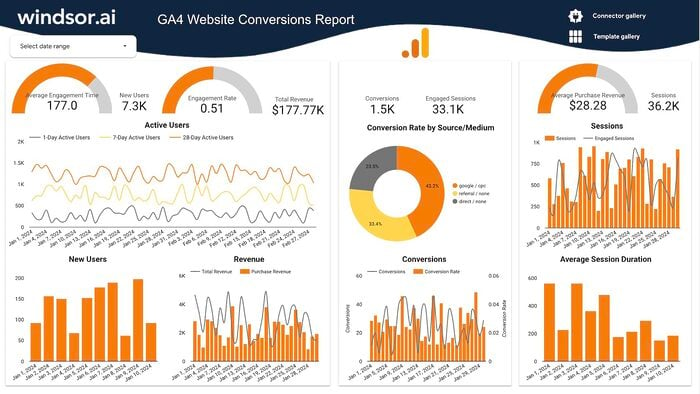
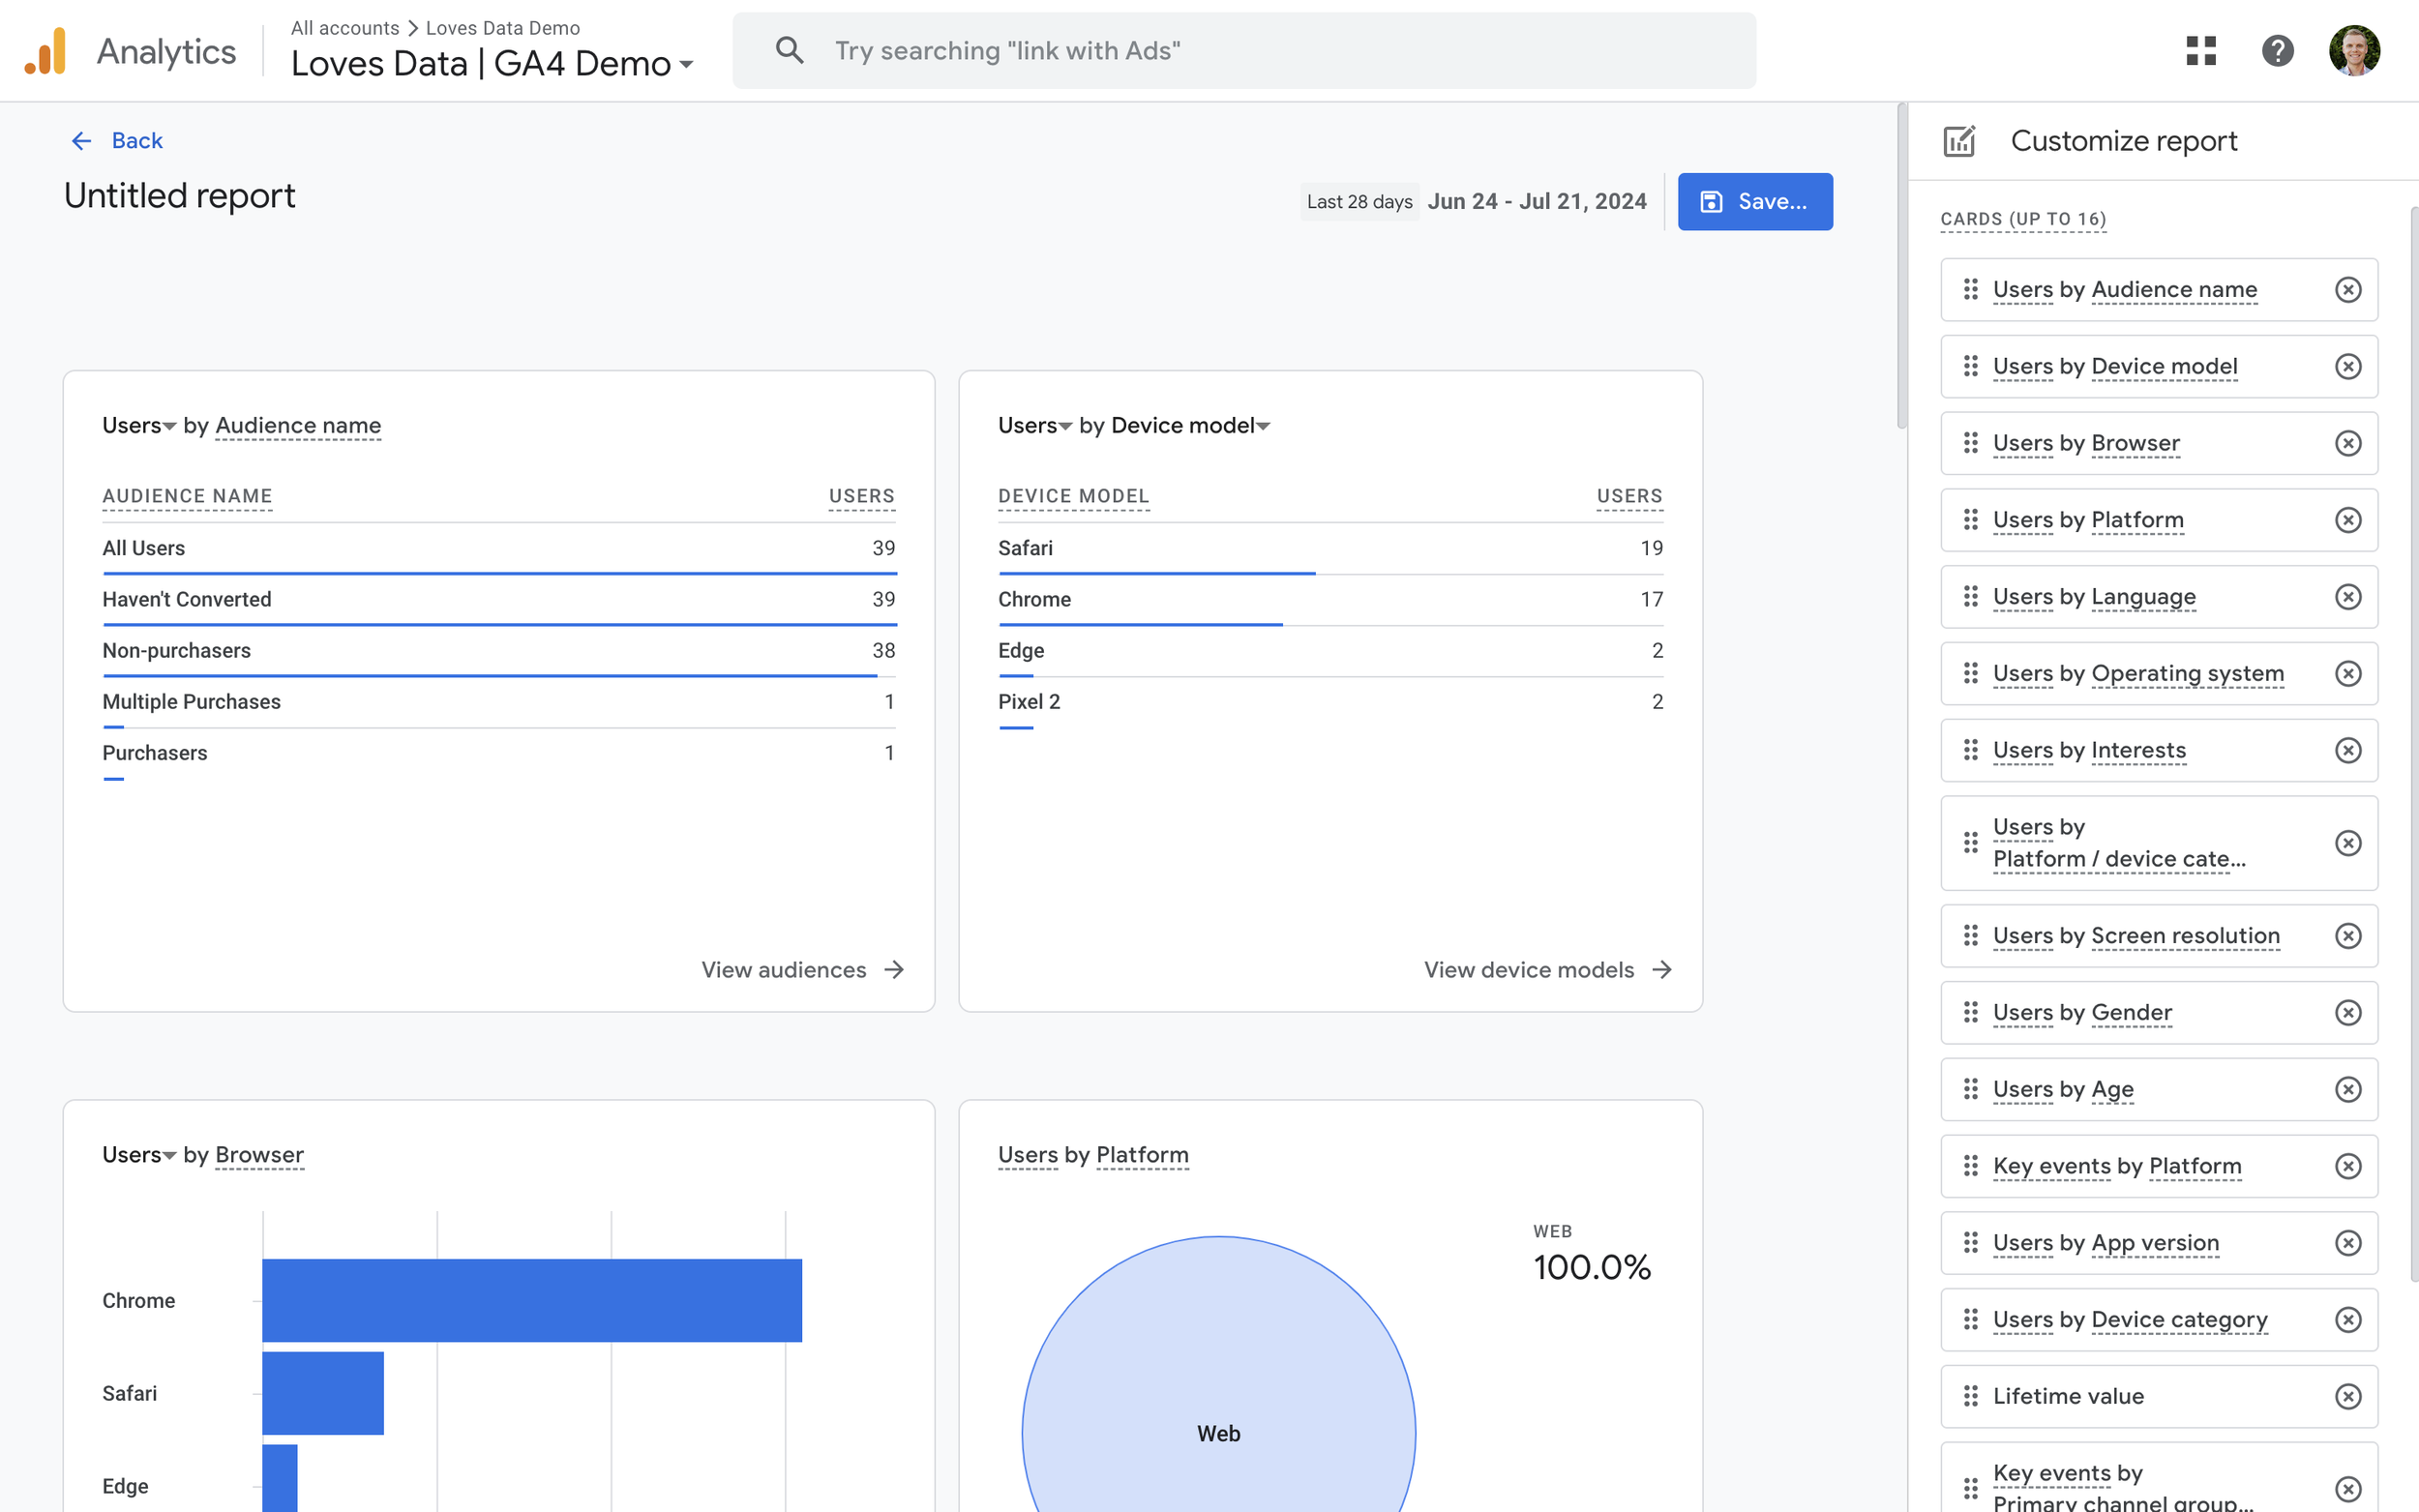
- Use the Create New Report or customize existing overview reports by adding up to 16 cards. Each card can display different metrics such as user acquisition, engagement, retention, or monetization.
- Cards can be visualized as tables, bar charts, donut charts, or maps, allowing editorial teams to quickly interpret data relevant to content performance.
- Rearrange cards by dragging and dropping to prioritize the most important metrics for editorial decision-making.
-
Add Relevant Metrics and Dimensions
- Use the Variables panel to add dimensions (e.g., page title, source/medium) and metrics (e.g., engaged sessions, average engagement time) relevant to editorial content.
- Filters can be applied to focus on specific audience segments, such as highly engaged users or visitors who viewed multiple articles.
-
Use Explorations for Advanced Reporting
- For editorial teams interested in user journeys or conversion funnels (e.g., newsletter signups after reading articles), use Path Exploration or Funnel Exploration reports.
- Free-Form Exploration allows drag-and-drop customization to analyze user behavior across different content pieces.
-
Sharing and Scheduling Reports
- Dashboards and reports can be shared with team members or scheduled for email delivery if you have admin access, facilitating regular editorial review meetings.
Additional Tips for Editorial Teams:
- Start with default overview reports and customize them to include editorial KPIs such as page views per article, average engagement time, scroll depth, and user retention.
- Use audience filters to segment loyal readers or high-engagement visitors to understand what content resonates best.
- Visualize data in formats that are easy for editorial teams to interpret quickly, such as bar charts for top-performing articles or tables for traffic sources.
This approach enables editorial teams to transform raw GA4 data into actionable insights, helping optimize content strategy and audience engagement effectively.


Maple Ranking offers the highest quality website traffic services in Canada. We provide a variety of traffic services for our clients, including website traffic, desktop traffic, mobile traffic, Google traffic, search traffic, eCommerce traffic, YouTube traffic, and TikTok traffic. Our website boasts a 100% customer satisfaction rate, so you can confidently purchase large amounts of SEO traffic online. For just 720 PHP per month, you can immediately increase website traffic, improve SEO performance, and boost sales!
Having trouble choosing a traffic package? Contact us, and our staff will assist you.
Free consultation